Table of Contents
- Advanced Data Visualization Techniques for Marketers
- Understanding the Importance of Data Visualization in Marketing
- Key Advanced Data Visualization Techniques for Marketers
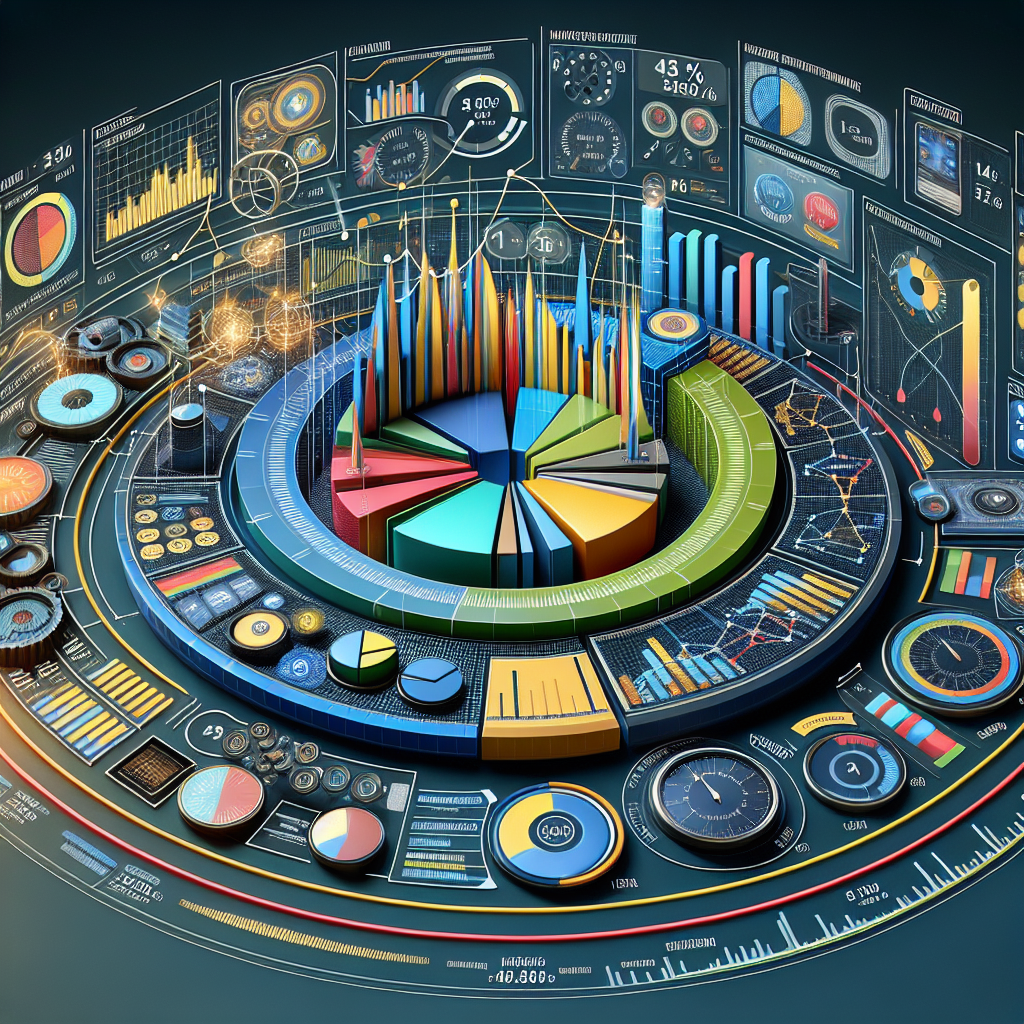
- Interactive Dashboards
- Geospatial Mapping
- Advanced Infographics
- Case Studies: Successful Implementation of Advanced Visualization Techniques
- Case Study 1: Using Heat Maps to Increase Retail Store Efficiency
- Case Study 2: Interactive Dashboards for Real-Time Social Media Monitoring
- Statistical Evidence Supporting Advanced Visualization
- Best Practices in Implementing Advanced Visualization Techniques
- Future Trends in Data Visualization for Marketing
- Conclusion: Harnessing the Power of Advanced Visualization
Advanced Data Visualization Techniques for Marketers
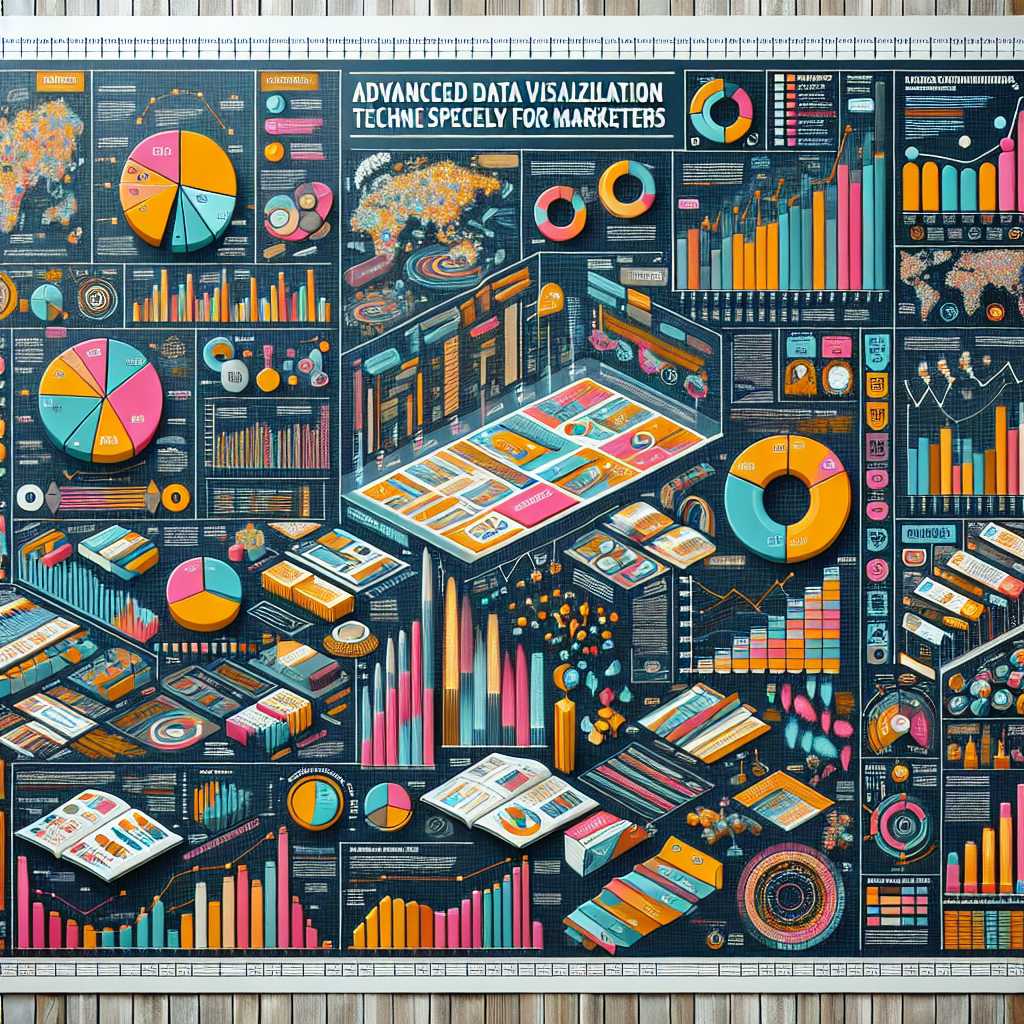
In today’s data-driven marketing landscape, the ability to analyze and visualize data effectively is not just advantageous—it’s essential. Advanced data visualization techniques enable marketers to uncover hidden patterns, identify market trends, and make data-backed decisions swiftly. This article explores various sophisticated data visualization methods that can transform complex data sets into clear, insightful visual representations, enhancing marketing strategies and outcomes.
Understanding the Importance of Data Visualization in Marketing
Data visualization is a powerful tool for marketers, providing an immediate way to see and understand trends, outliers, and patterns in data. In the realm of marketing, where data is voluminous and often complex, visualization helps in simplifying the information, making it more accessible and actionable for decision-makers.
- Quick assimilation of information
- Identification of new patterns
- Effective communication of insights to stakeholders
By leveraging advanced data visualization techniques, marketers can enhance both the speed and quality of their strategic decisions.
Key Advanced Data Visualization Techniques for Marketers
Interactive Dashboards
Interactive dashboards are at the forefront of advanced data visualization. They provide a dynamic interface where users can manipulate data to view different metrics and dimensions. Tools like Tableau, Power BI, and Google Data Studio allow marketers to create customizable dashboards that can include a variety of complex visualizations such as heat maps, bubble charts, and real-time data streams.
Geospatial Mapping
Geospatial mapping is a compelling way to visualize data that has a geographical component. It can be particularly useful for marketers looking to analyze market penetration, regional sales distributions, or logistics. Tools like ArcGIS and QGIS enhance the ability to overlay additional data points on a map, such as demographic information, allowing for deeper insights into market dynamics.
Advanced Infographics
While infographics are not new, their complexity and functionality have increased with advancements in digital technology. Modern infographics can include interactive elements, such as clickable tabs or hover-over information, making them more engaging and informative. These advanced infographics can be used effectively in digital marketing campaigns to attract user engagement and convey complex information in an easily digestible format.
Case Studies: Successful Implementation of Advanced Visualization Techniques
Case Study 1: Using Heat Maps to Increase Retail Store Efficiency
A major retail chain implemented heat maps to analyze customer foot traffic in their stores. By visualizing the areas with the highest concentration of customers, the retailer was able to optimize the placement of high-margin products, significantly boosting sales. This strategic placement also improved customer experience, as popular items were made more accessible.
Case Study 2: Interactive Dashboards for Real-Time Social Media Monitoring
A digital marketing agency developed an interactive dashboard for a client to monitor real-time social media engagement during a product launch. The dashboard displayed data from various social platforms, allowing the marketing team to quickly identify and react to trends, engage with influencers, and optimize their ad spend based on real-time data.
Statistical Evidence Supporting Advanced Visualization
According to a recent survey by Forbes, companies that adopt advanced visualization techniques are three times more likely to report strong financial performance. Furthermore, a study by the Aberdeen Group found that managers who utilize visual data discovery tools are 28% more likely to find timely information than those who rely solely on managed reporting and dashboards.
Best Practices in Implementing Advanced Visualization Techniques
- Start with clear objectives: Understand what you want to achieve with your visualization.
- Choose the right tool: Select a visualization tool that best fits your needs and data complexity.
- Keep the audience in mind: Design your visualizations for the target audience’s understanding and action.
- Focus on actionable insights: Ensure that the visualization provides clear paths to action rather than just presenting data.
Future Trends in Data Visualization for Marketing
As technology evolves, so too do the possibilities for advanced data visualization. Future trends include the integration of AI and machine learning for predictive analytics, increased use of augmented reality (AR) and virtual reality (VR) for immersive data experiences, and greater emphasis on real-time data visualization for instant decision-making.
Conclusion: Harnessing the Power of Advanced Visualization
Advanced data visualization techniques offer marketers a profound edge in navigating the complex and data-rich world of modern marketing. By effectively implementing techniques such as interactive dashboards, geospatial mapping, and advanced infographics, marketers can reveal significant insights that drive strategic decisions and foster business growth. As we look to the future, the role of advanced data visualization in marketing will only grow, becoming a critical component of successful marketing strategies.
Embracing these advanced techniques will not only enhance the understanding of consumer behavior and market trends but also empower marketers to act swiftly and with confidence, backed by data-driven insights.